

Physics-(general)
NEET Physics (general) MCQ Question
Type: MCQ-diagram based-Medium-Class 11
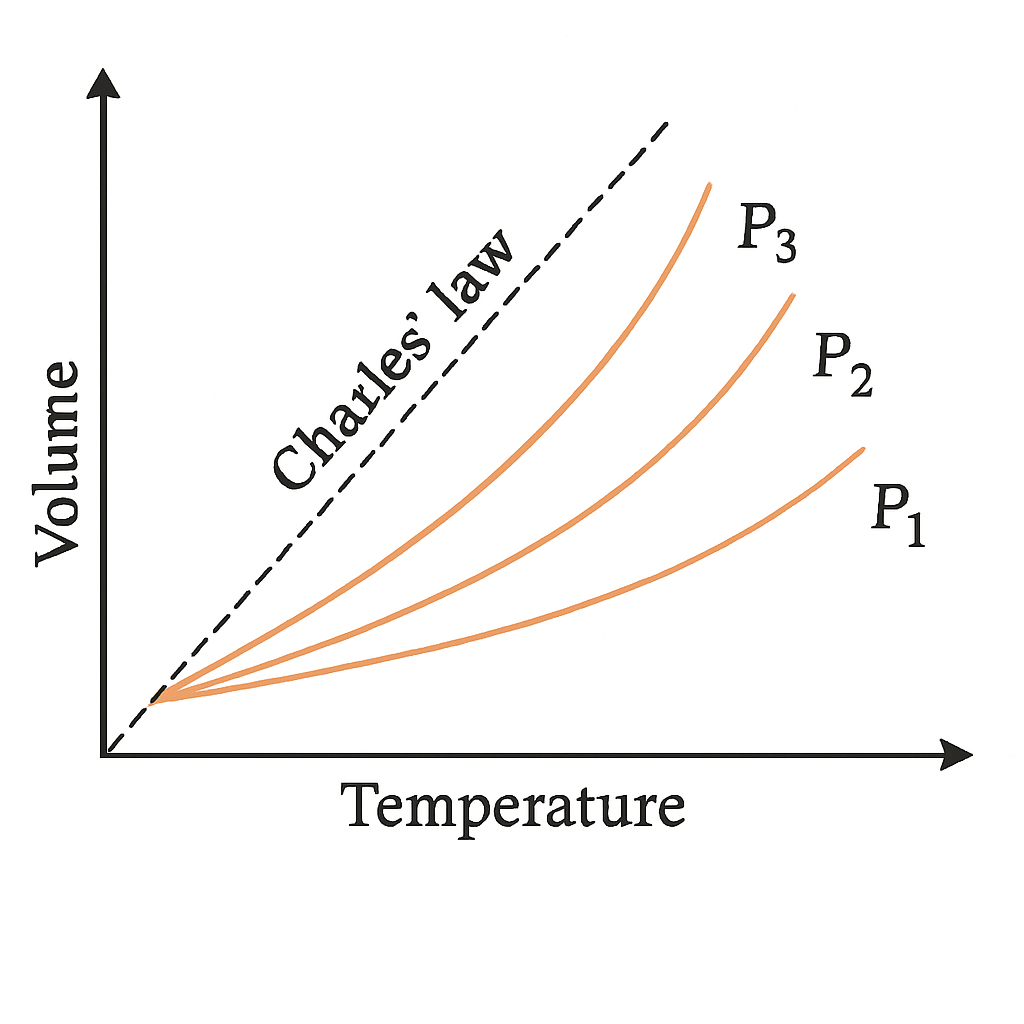
Consider a diagram of experimental T-V curves for CO2 at three different pressures compared to Charles' law. Which aspect of these curves demonstrates the deviation from ideal gas behavior at high pressures?
A
The curves show a decrease in volume with increasing temperature.
B
The curves become steeper as pressure increases, deviating from the dotted lines.
C
The curves intersect at low temperatures, suggesting ideal gas behavior.
D
The curves flatten out at higher temperatures, aligning with Charles' law.
Correct Answer
Option B
Detailed Explanation
The experimental T-V curves deviate from the dotted lines representing Charles' law due to non-ideal behavior at high pressures, as shown by the steeper curves.
Found an issue with this question?