

Physics-(general)
NEET Physics (general) MCQ Question
Type: MCQ-diagram based-Medium-Class 11
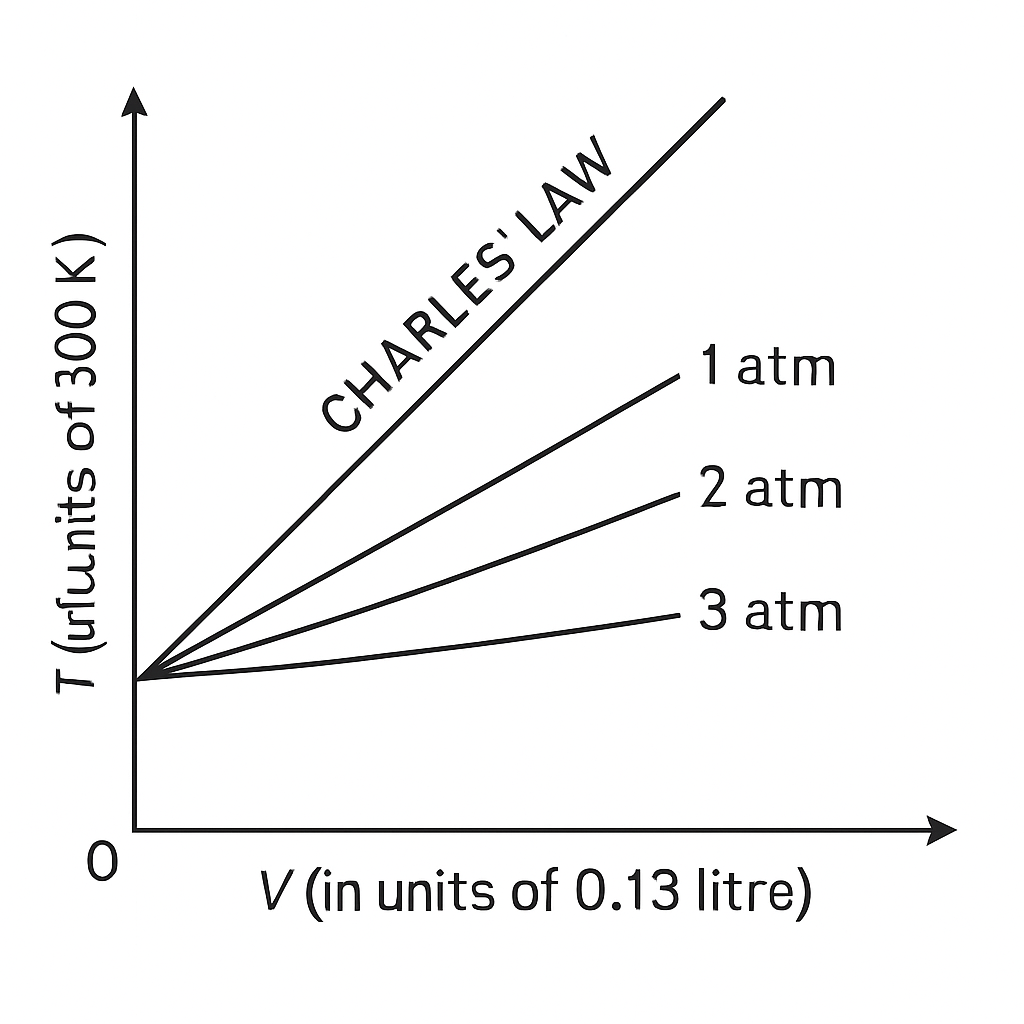
Consider a diagram showing experimental T-V curves for CO2 at three different pressures, compared with Charles' law. If the temperature is in units of 300 K and the volume is in units of 0.13 litres, which of the following statements can be inferred from the diagram?
A
The real gas deviates from ideal behavior at high pressures.
B
The volume of CO2 decreases linearly with temperature.
C
CO2 follows Charles' law exactly at all pressures.
D
The pressure of CO2 has no effect on its volume at a given temperature.
Correct Answer
Option A
Detailed Explanation
The NCERT context describes T-V curves for CO2 at different pressures, showing deviations from ideal behavior, particularly at high pressures.
Found an issue with this question?