

NEET Chemistry Chemical Equilibrium MCQ Question
In the diagram shown above, which graph best represents the change in concentration of H2 as the reaction H2(g) + I2(g) → 2HI(g) proceeds to equilibrium?
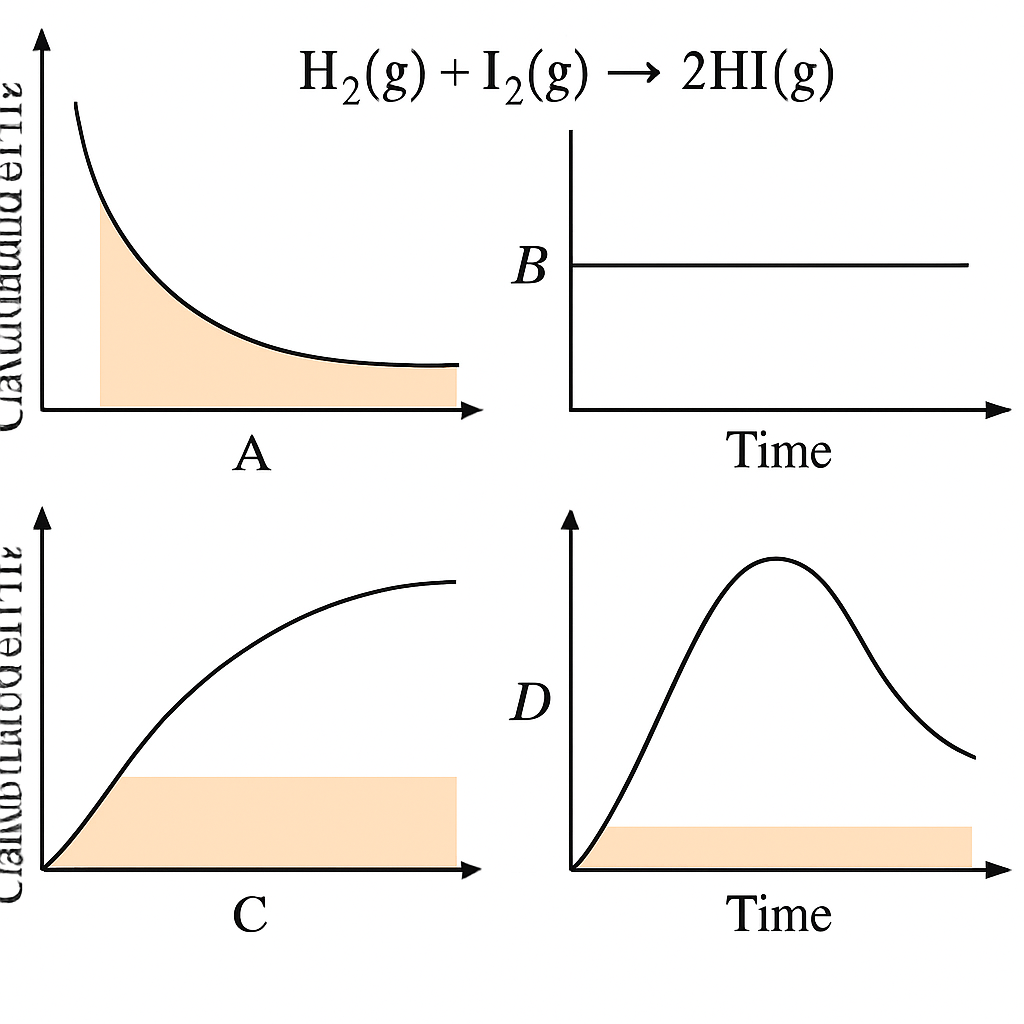
Graph A shows a decrease in concentration of H2 until it levels off.
Graph B shows a constant concentration of H2 throughout the reaction.
Graph C shows an increase in concentration of H2 until it levels off.
Graph D shows a rapid increase in concentration of H2 followed by a slow decrease.
Correct Answer
Detailed Explanation
As the reaction proceeds towards equilibrium, the concentration of H2 decreases and eventually levels off when equilibrium is reached, as described in the NCERT context.
Found an issue with this question?
Related Questions
More from Chemical Equilibrium
More from
Assertion (A): For a dibasic acid H2X, the equilibrium constant for the first ionization step (Ka1) is generally greater than that for the second ioni...
Assertion (A): The solubility of a sparingly soluble salt is affected by the presence of a common ion. | Reason (R): The solubility product constant (...
Match Column-I with Column-II. Column-I Column-II (a) Solubility Product Constant (K sp) (i) Represents maximum concentration of ions in s...