

NEET Physics Kinetic Interpretation of Temperature MCQ Question
A diagram depicts the Maxwell distribution curve of molecular speeds in a gas at a fixed temperature. If the area under the curve represents the fraction of molecules with speeds between v and v+dv, what does the peak of this curve indicate?
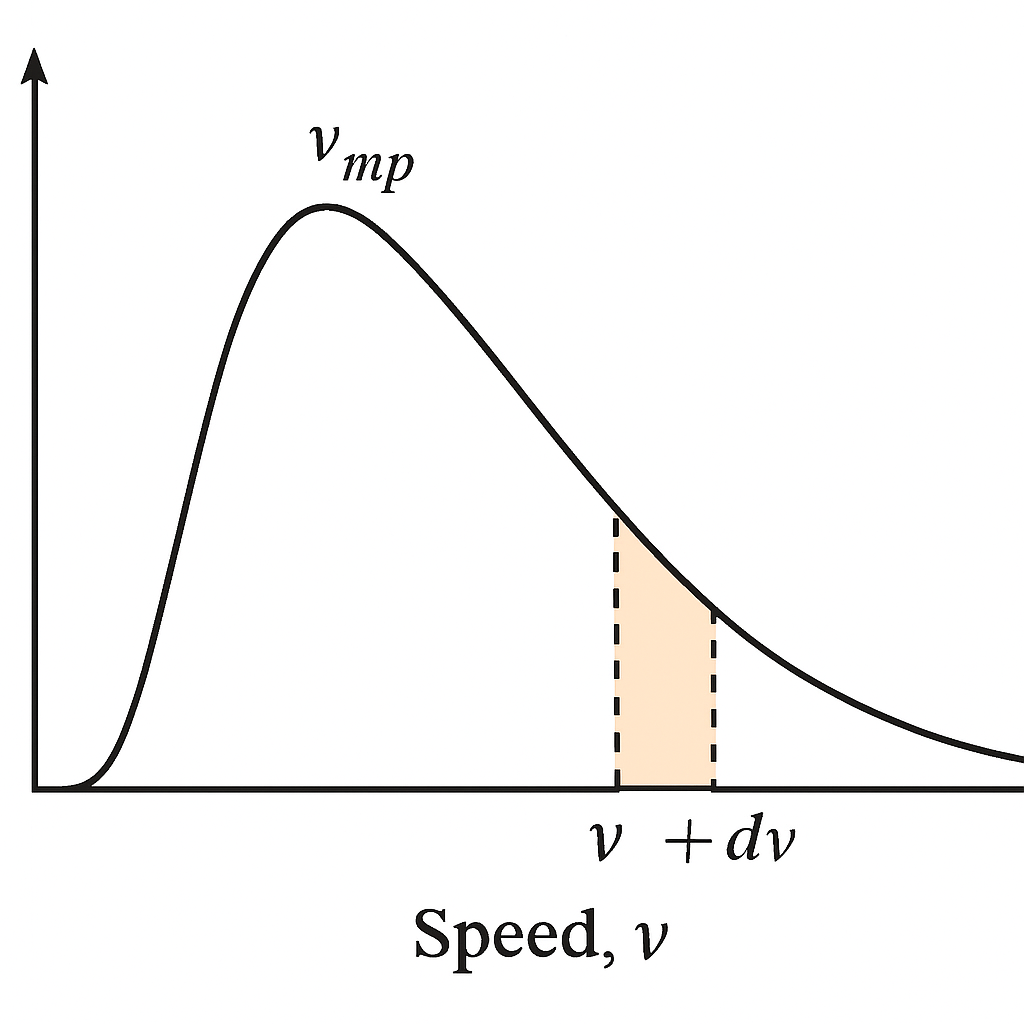
Most probable speed of the molecules.
Average speed of the molecules.
Root mean square speed of the molecules.
Speed of sound in the gas.
Correct Answer
Detailed Explanation
The peak of the Maxwell distribution curve represents the most probable speed, which is the speed at which the maximum number of molecules are moving. This is consistent with the statistical interpretation of molecular speeds.
Found an issue with this question?
Related Questions
More from Kinetic Interpretation of Temperature
More from
Assertion (A): The distribution of molecular speeds in a gas remains constant in a state of equilibrium. | Reason (R): Collisions between molecules ch...
Assertion (A): A molecule constrained to move in a plane has two degrees of freedom. | Reason (R): Motion in different spatial dimensions requires dif...
Match Column-I with Column-II. Column-I Column-II (a) Motion constrained to a line (i) Three degrees of freedom (b) Motion constrained to a...