

NEET Chemistry Raoult's Law MCQ Question
Consider a graph where the x-axis represents the mole fraction of a solvent (x1) and the y-axis represents the vapor pressure (p1). Which of the following statements best describes the relationship shown in this graph according to Raoult's Law?
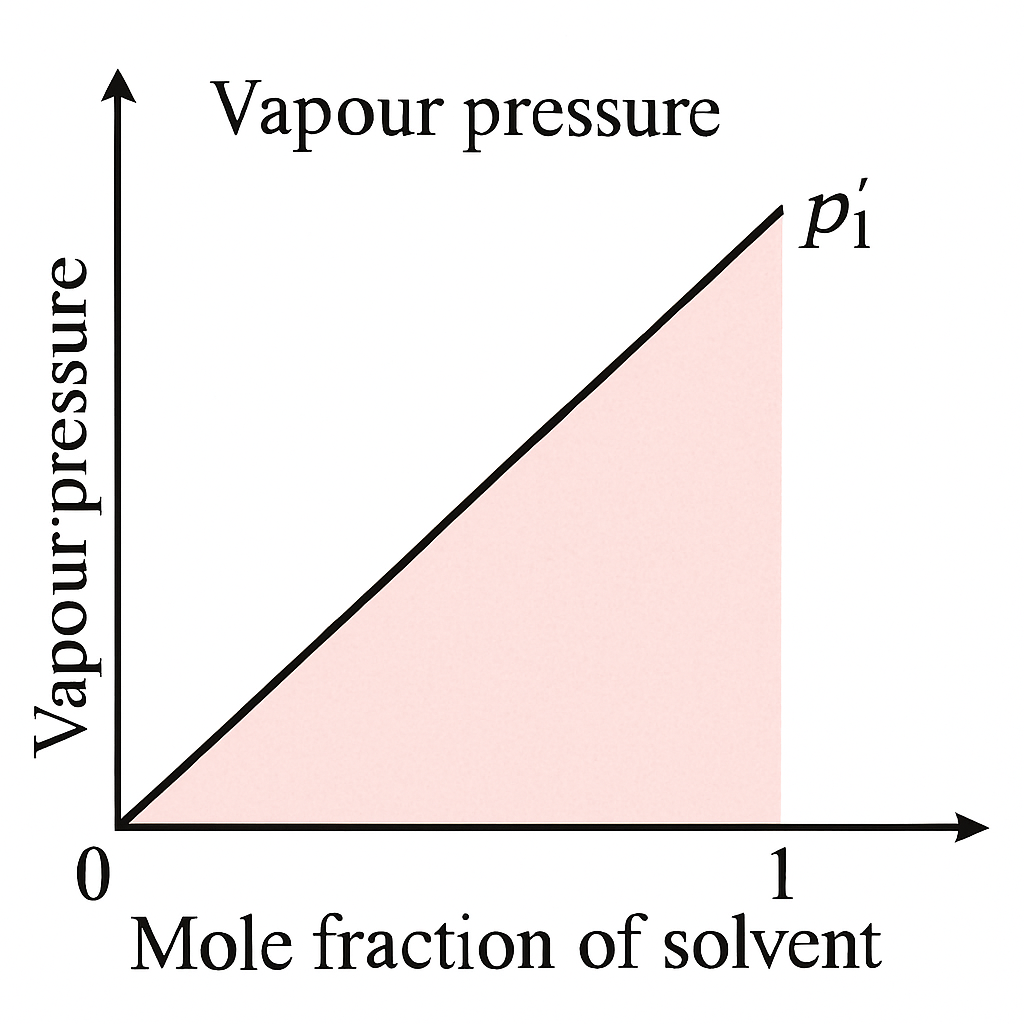
The graph is a straight line indicating a linear relationship.
The graph is a parabola indicating an exponential relationship.
The graph is a horizontal line indicating no change in vapor pressure.
The graph shows a maximum point indicating a peak in vapor pressure.
Correct Answer
Detailed Explanation
According to Raoult's Law, the plot between the vapor pressure and the mole fraction of the solvent is linear, indicating a direct proportionality.
Found an issue with this question?
Related Questions
More from Raoult's Law
More from
Calculate the total vapour pressure of an ideal solution at a certain temperature if the mole fraction of component 1 is 0.4, its vapour pressure in p...
Given that the vapour pressures of pure acetone and chloroform at 328 K are 741.8 mm Hg and 632.8 mm Hg respectively, what is the total vapour pressur...