

NEET Chemistry Raoult's Law MCQ Question
Consider a graph depicting the relationship between vapour pressure and mole fraction for a liquid-liquid solution that obeys Raoult's Law. Which of the following statements best describes the nature of the graph?
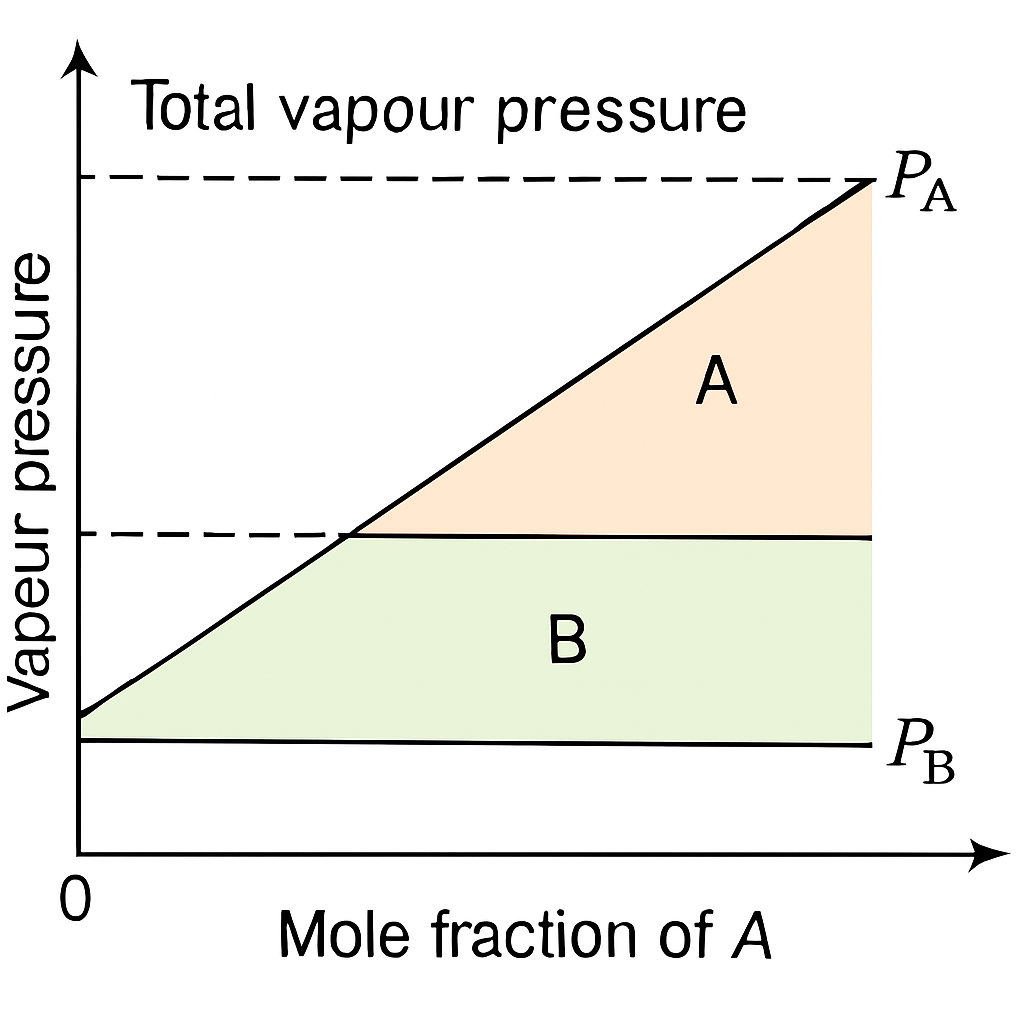
The graph is a straight line indicating an ideal solution with zero enthalpy of mixing.
The graph is a curve indicating a non-ideal solution with positive enthalpy of mixing.
The graph is a straight line indicating a non-ideal solution with zero volume change on mixing.
The graph is a curve indicating an ideal solution with negative volume change on mixing.
Correct Answer
Detailed Explanation
According to Raoult's Law, a plot of vapour pressure against the mole fraction for an ideal solution is linear, indicating zero enthalpy and volume change on mixing.
Found an issue with this question?
Related Questions
More from Raoult's Law
More from
Calculate the total vapour pressure of an ideal solution at a certain temperature if the mole fraction of component 1 is 0.4, its vapour pressure in p...
Given that the vapour pressures of pure acetone and chloroform at 328 K are 741.8 mm Hg and 632.8 mm Hg respectively, what is the total vapour pressur...