

NEET Chemistry Rate of Reaction MCQ Question
Imagine a diagram showing the potential energy vs reaction coordinate plot for the formation of hydrogen iodide from hydrogen and iodine. Label the peak of this curve. What does this peak represent in the context of the reaction?
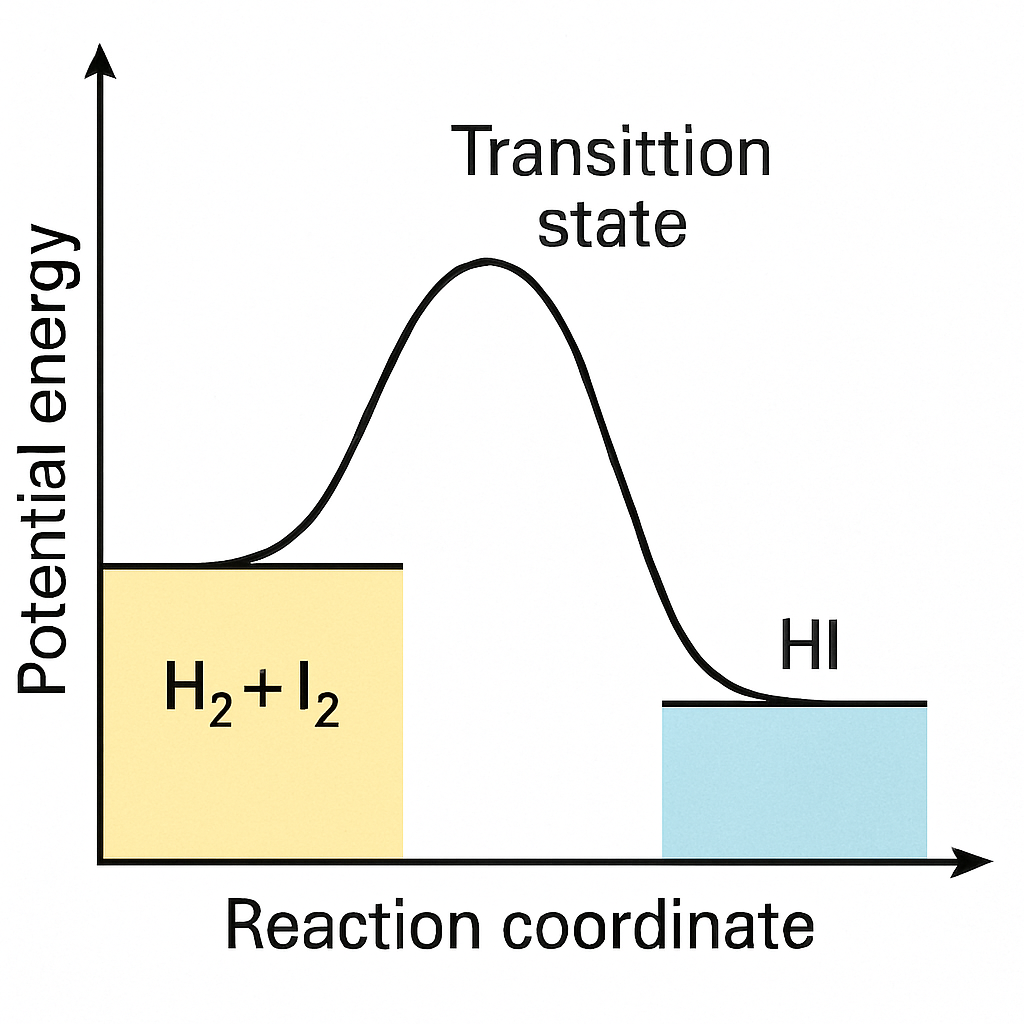
Transition state
Reactants
Products
Activation energy
Correct Answer
Detailed Explanation
The peak of the potential energy vs reaction coordinate plot represents the transition state, an unstable intermediate formed during the reaction, as per the Arrhenius explanation.
Found an issue with this question?
Related Questions
More from Rate of Reaction
Which of the following factors does NOT affect the rate of a chemical reaction?
Assertion (A): The rate constant of a first-order reaction is independent of the initial concentration of the reactants. | Reason (R): The half-life o...
Assertion (A): The rate of a zero order reaction is independent of the concentration of the reactants. | Reason (R): In a zero order reaction, the rat...
More from
Consider a potential energy diagram where the y-axis represents potential energy and the x-axis represents the reaction coordinate. Which point on the...
Match Column-I with Column-II. Column-I Column-II (a) Rate Law (i) k [A] x [B] y (b) Differential Rate Equation (ii) Reaction order (c)...