

NEET Chemistry Quantum Mechanical Model MCQ Question
Consider a diagram depicting the variation of as a function of distance from the nucleus for 1s and 2s orbitals. Which of the following statements correctly describes the probability density distribution for these orbitals?
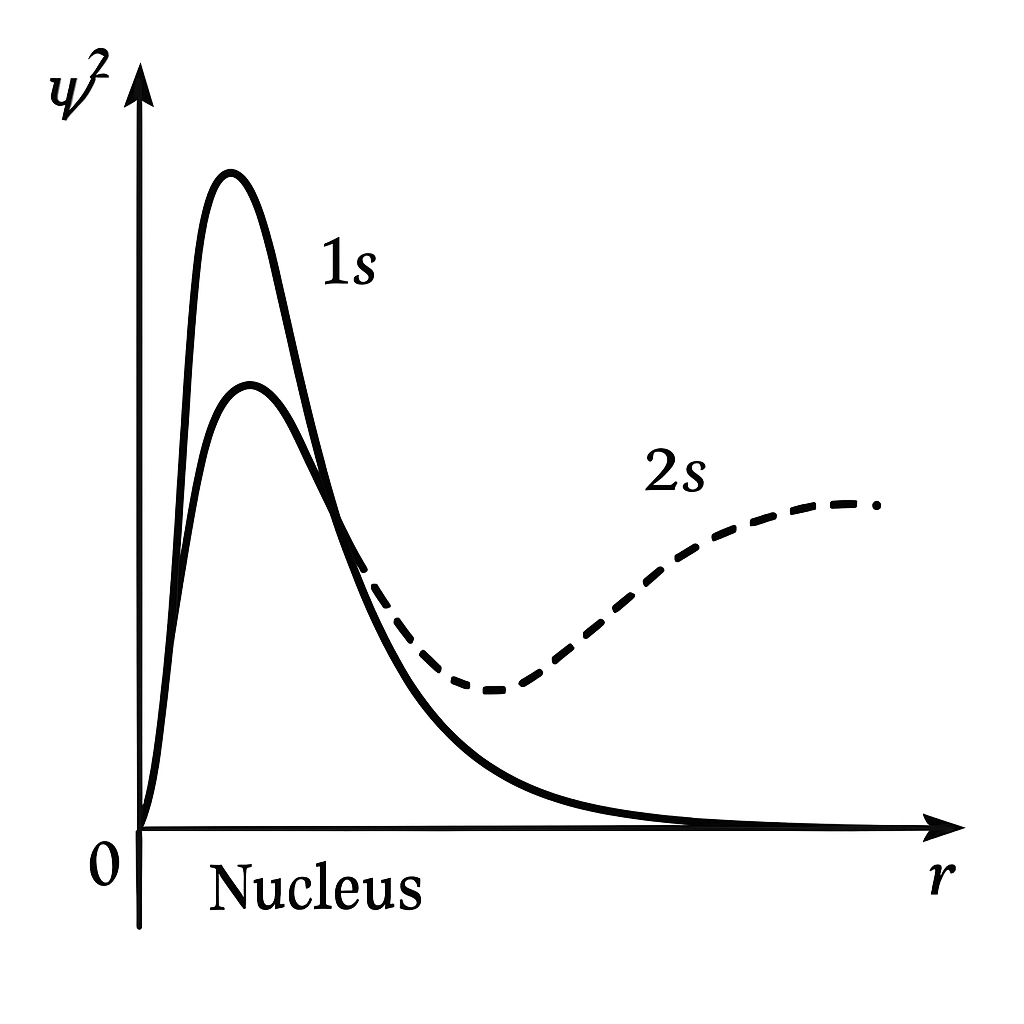
The probability density for 1s orbital is maximum at the nucleus and decreases sharply with distance.
The probability density for 2s orbital is maximum at the nucleus and remains constant with distance.
The probability density for 1s orbital increases with distance from the nucleus, showing multiple maxima.
The probability density for 2s orbital has a single maximum at a point away from the nucleus.
Correct Answer
Detailed Explanation
According to the NCERT context, the probability density for 1s orbital is maximum at the nucleus and decreases sharply as we move away from it. In contrast, the 2s orbital shows a decrease, then an increase to a small maximum, and then a further decrease.
Found an issue with this question?
Related Questions
More from Quantum Mechanical Model
More from
What is the energy in joules associated with the fifth orbit of a hydrogen atom if the energy associated with the first orbit is -2.18 × 10^(-18) J?
According to the de Broglie equation, what is the wavelength of an electron with a kinetic energy of 2.0 × 10^−25 J and mass 9.1 × 10^−31 kg?
The maximum number of electrons in a subshell is given by the expression