STANDARDPhysics-Thermodynamics
STANDARD Physics P-V and T-P Diagrams MCQ Question
Type: MCQ-conceptual-Medium-Class 11
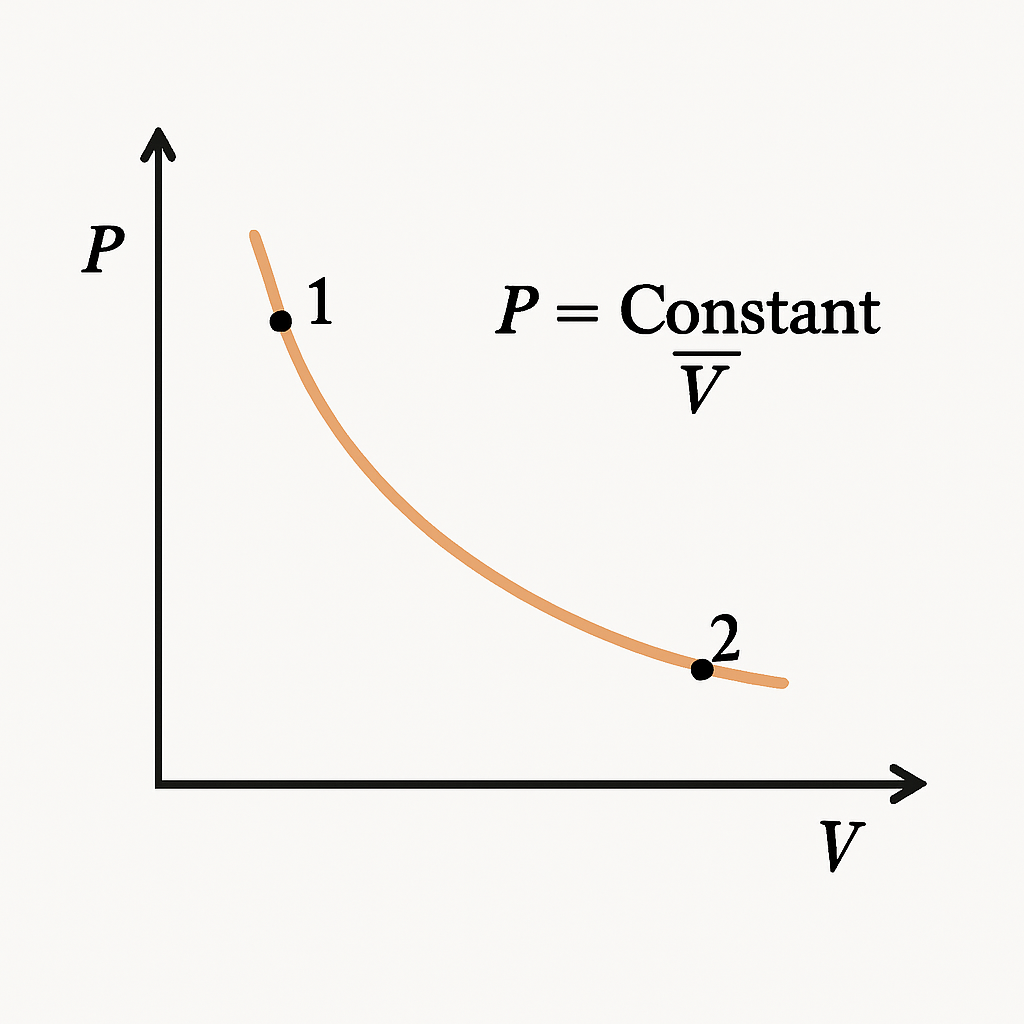
Consider P-V diagram for an ideal gas shown in figure. Out of the following diagrams, which represents the T-P diagram?
A
(iv)
B
(ii)
C
(iii)
D
(i)
Correct Answer
Option C
Detailed Explanation
In the given diagram T is constant and P₁ > P₂. Curve (iii) represents P₁ > P₂ and a straight line graph, parallel to the pressure axis indicating constant T.
Found an issue with this question?
Related Questions
More from
Which of the following statements about enthalpy changes in thermodynamics is correct?
(general)Physics
What is the enthalpy change associated with the atomization of dihydrogen (H2)?
(general)Physics
For a strongly endothermic reaction, what is the expected value of the equilibrium constant K?
(general)Physics