STANDARDPhysics-Thermodynamics
STANDARD Physics Isothermal Processes MCQ Question
Type: MCQ-conceptual-Medium-Class 11
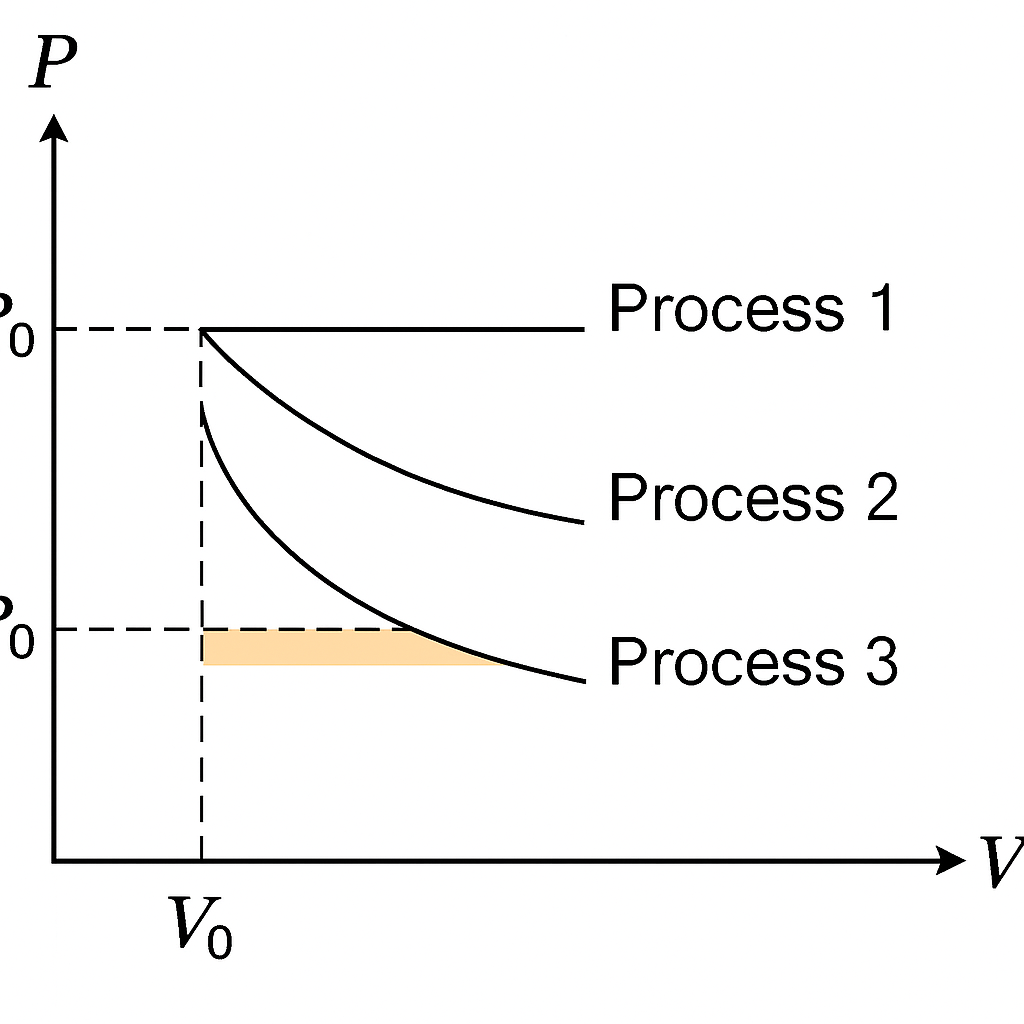
The isothermal diagram of a gas at three different temperatures T₁, T₂ and T₃, is shown in the given figure. Then
A
T₁ < T₂ < T₃
B
T₁ < T₂ > T₃
C
T₁ > T₂ > T₃
D
T₁ > T₂ < T₃
Correct Answer
Option C
Detailed Explanation
The given diagram shows that the curves move away from the origin at higher temperature.
Found an issue with this question?