

NEET Physics (general) MCQ Question
Consider a diagram showing a graph of binding energy per nucleon versus mass number for nucleons in a nucleus. Which of the following best describes the general trend observed in the binding energy curve?
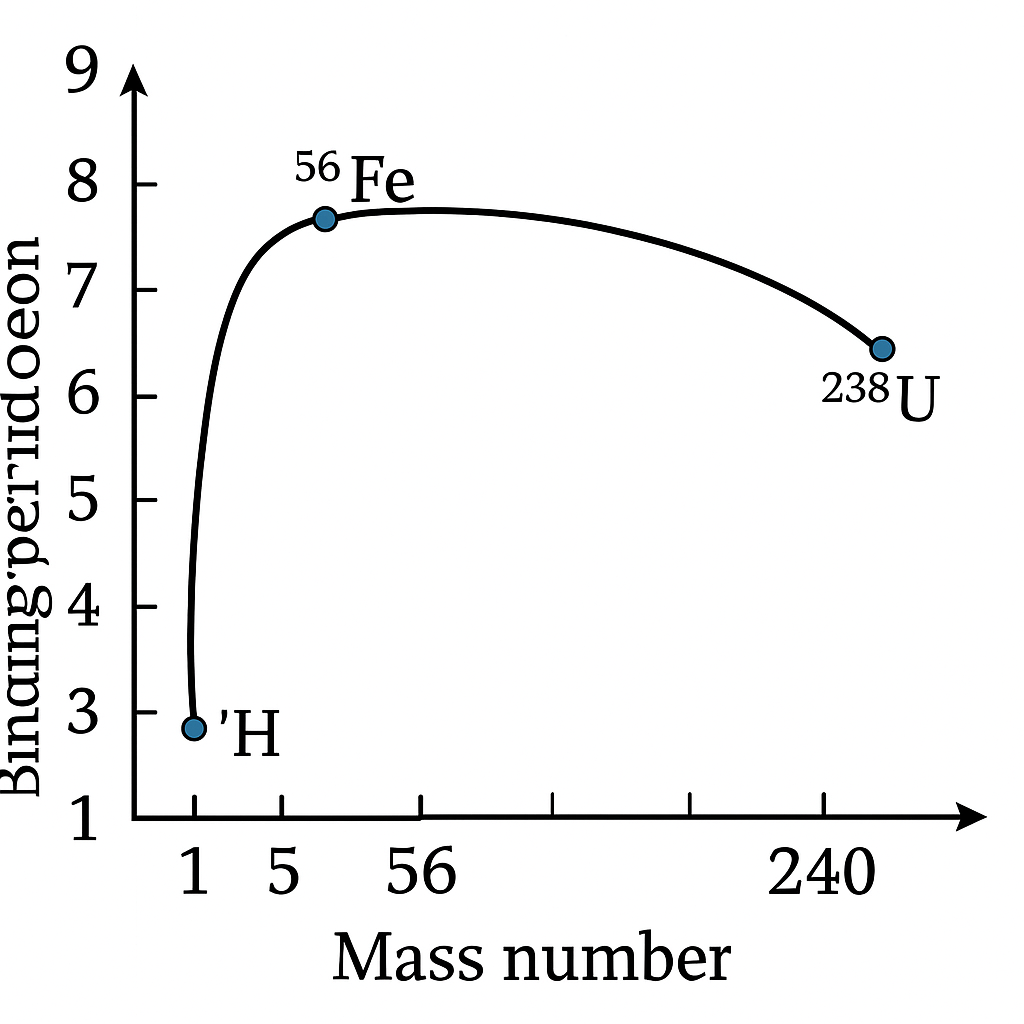
Binding energy per nucleon generally increases with mass number up to iron, then decreases.
Binding energy per nucleon decreases continuously as mass number increases.
Binding energy per nucleon remains constant regardless of the mass number.
Binding energy per nucleon decreases with mass number up to iron, then increases.
Correct Answer
Detailed Explanation
The binding energy curve generally shows an increase in binding energy per nucleon as the mass number increases up to iron, after which it decreases. This trend is key to understanding nuclear stability and processes.
Found an issue with this question?