

NEET 2022 Physics de Broglie Wavelength MCQ Question
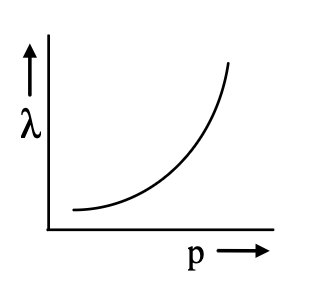
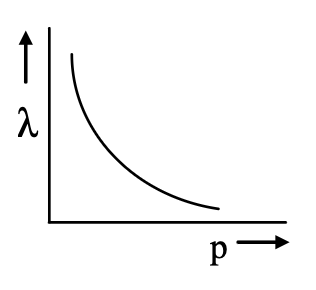
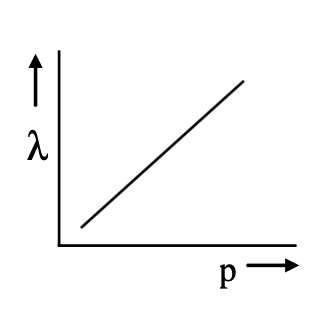
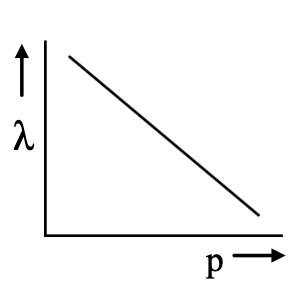
The graph which shows the variation of the de Broglie wavelength (λ) of a particle and its associated momentum (p) is:
Correct Answer
Detailed Explanation
Chapter: Dual Nature of Radiation and Matter Class: 12 Physics — Chapter 11 Topic: de Broglie Wavelength Difficulty: 🟡 Medium
✅ Ans: 2 — Option B
The de Broglie relation is:
Since is constant:
So, as momentum increases, wavelength decreases inversely.
Therefore, the graph must be a decreasing rectangular hyperbola.
The screenshot's green tick on A is incorrect; the NEET 2022 solution identifies the inverse-curve graph as the correct one. (v4edu.in)
🧠 NEET Trick:
Found an issue with this question?
Related Questions
More from de Broglie Wavelength
Match Column-I with Column-II. Column-I Column-II (a) de Broglie wavelength of an electron (i) 6.63 × 10^-34 J s (b) de Broglie wavelength...
What is the de Broglie wavelength of a particle with mass 0.15 kg moving at a speed of 30.0 m/s?
Which of the following statements about de Broglie wavelength is correct?