

NEET2020Physics-Electricity
NEET 2020 Physics Resistivity MCQ Question
Type: MCQ-conceptual-Easy-Class 12
Which of the following graph represents the variation of resistivity (ρ) with temperature (T) for copper?
A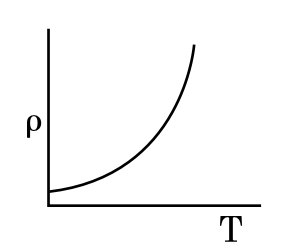
B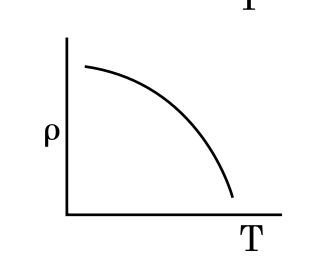
C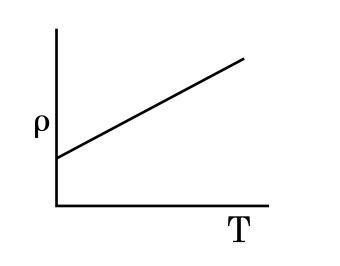
D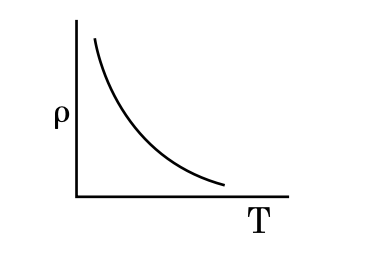
Correct Answer
Option A
Detailed Explanation
For metals like copper, resistivity increases with temperature due to increased lattice vibrations.
Found an issue with this question?
Related Questions
More from 2020
Goblet cells of alimentary canal are modified from:
Structural Organisation in AnimalsZoology
In a guitar, two strings A and B made of same material are slightly out of tune and produce beats of frequency 6 Hz. When tension in B is slightly dec...
WavesPhysics
Which of the following statements are true for the phylum-Chordata? (a) In Urochordata notochord extends from head to tail and it is present through...
Animal KingdomZoology