

NEET Physics Newton's Law of Cooling MCQ Question
Consider a graph depicting the cooling of a hot body over time, where the y-axis represents the temperature difference (∆T = T2 - T1) between the body and its surroundings, and the x-axis represents time. Which of the following best describes the shape of the curve according to Newton's Law of Cooling?
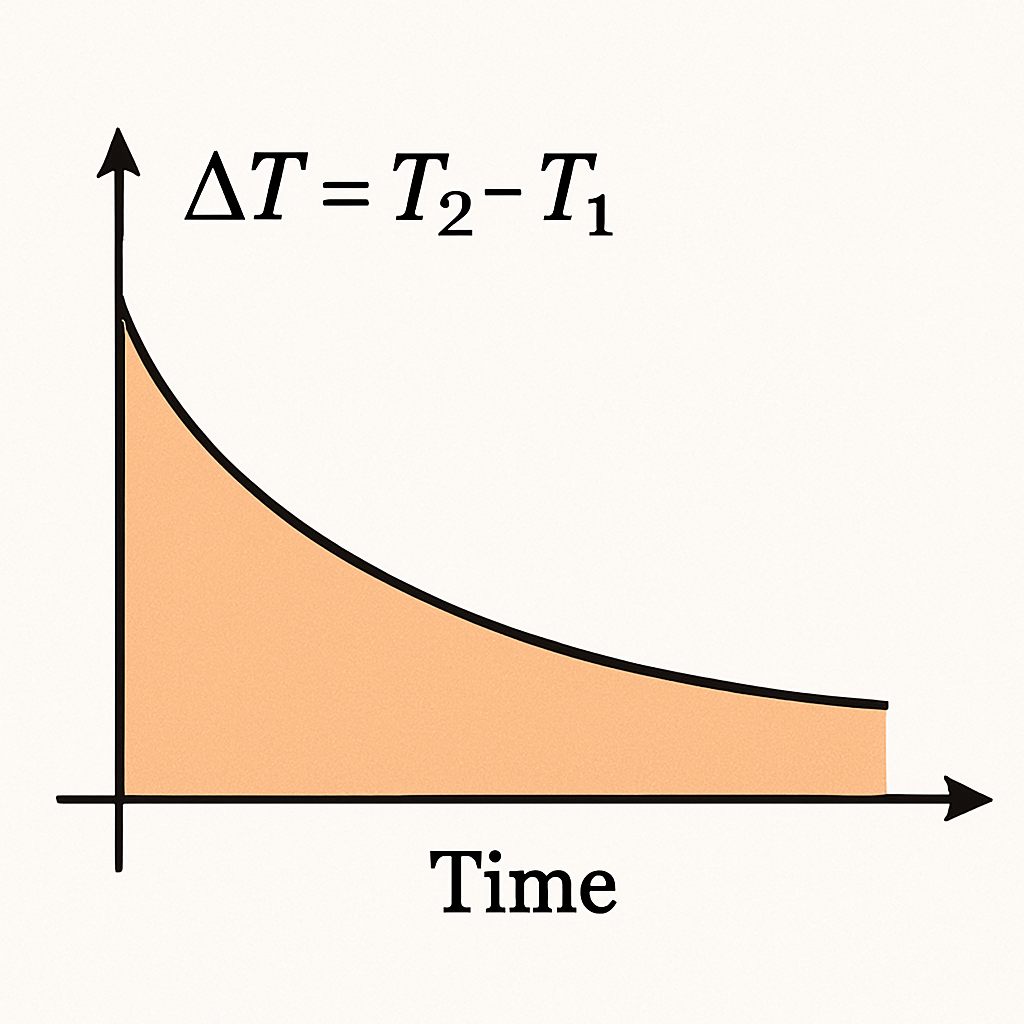
The curve is exponential, initially steep and then flattening out.
The curve is linear, with a constant slope.
The curve is sinusoidal, alternating between peaks and troughs.
The curve is parabolic, showing a sharp initial increase followed by a decrease.
Correct Answer
Detailed Explanation
The graph shows that the rate of cooling is initially higher and decreases over time, which corresponds to an exponential decrease as the temperature approaches that of the surroundings.
Found an issue with this question?
Related Questions
More from
Four rods of same material with different radii r and length are used to connect two reservoirs of heat at different temperatures. Which one will cond...
Match Column-I with Column-II. Column-I Column-II (a) Kelvin scale (i) 0 K (b) Water as coolant (ii) Heats up slowly (c) Heat of vaporisa...
What is the SI unit of specific heat capacity?