

NEET 2024 Physics Velocity and Acceleration Graphs MCQ Question
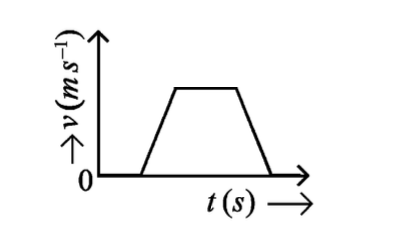
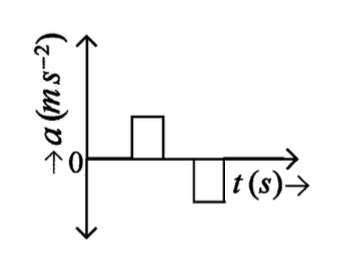
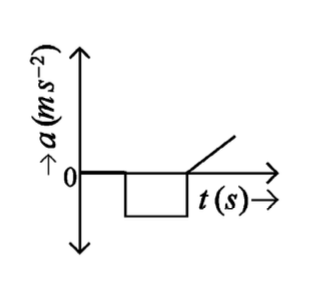
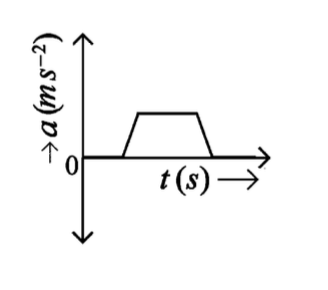
The velocity (v) – time (t) plot of the motion of a body is shown below. The acceleration (a) – time (t) graph that best suits this motion is:
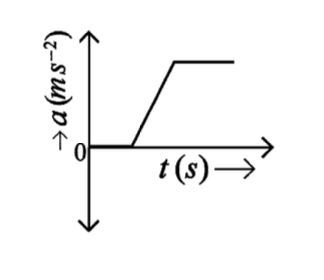
Correct Answer
Detailed Explanation
The velocity-time graph shows a constant velocity followed by a sudden stop. The acceleration-time graph should show zero acceleration during constant velocity and a negative spike when the velocity drops to zero.
Found an issue with this question?
Related Questions
More from Kinematics
More from 2024
Which of the following factors are favourable for the formation of oxyhaemoglobin in alveoli?
On heating, some solid substances change from solid to vapour state without passing through liquid state. The technique used for the purification of s...
The rate of a reaction quadruples when temperature changes from 27°C to 57°C. Calculate the energy of activation. Given R = 8.314 J K⁻¹ mol⁻¹, log 4 =...