

NEET Physics Speed & Velocity MCQ Question
A speed-time graph is plotted for a ball dropped from a height of 90 m. The ball loses one tenth of its speed at each collision with the floor. Which of the following statements correctly describes the graph between t = 0 to 12 s?
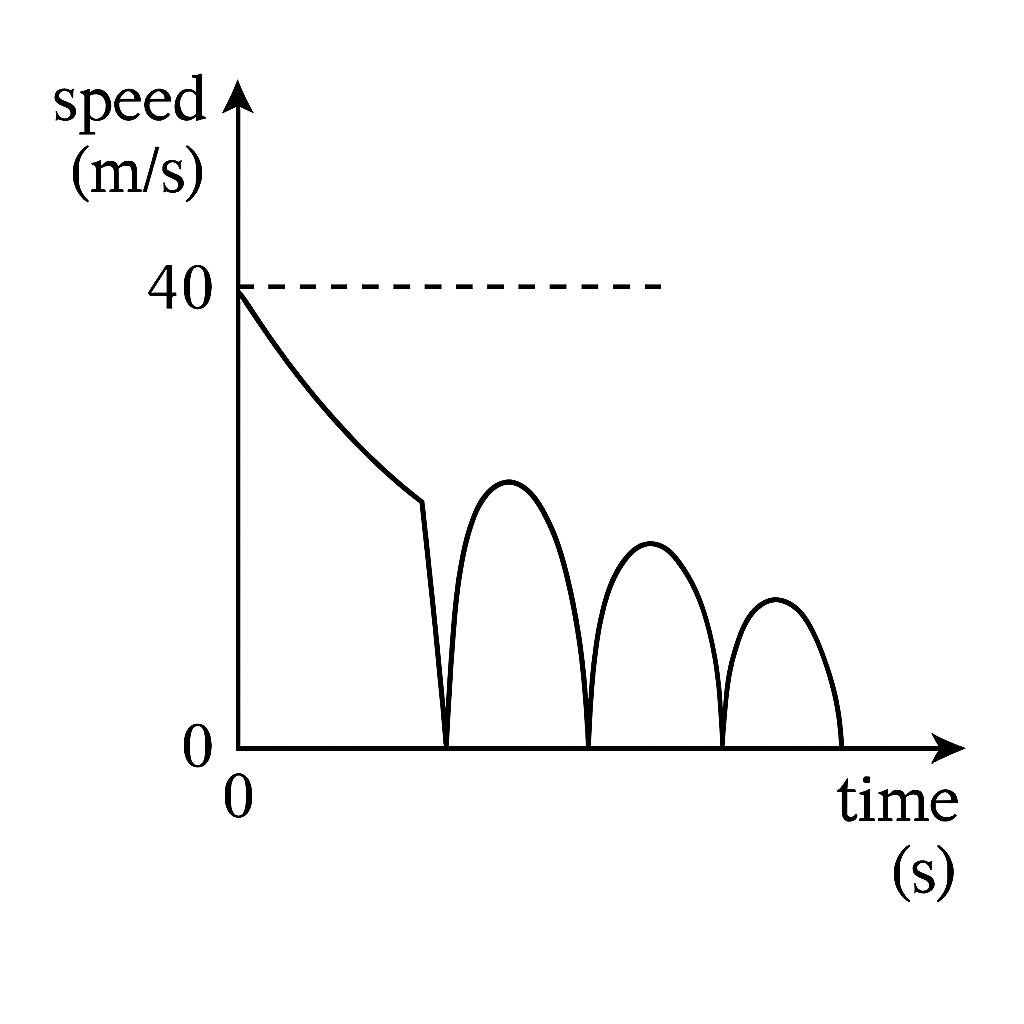
The graph shows a series of decreasing linear segments.
The graph shows a constant speed throughout the time interval.
The graph shows speed increasing uniformly after each bounce.
The graph shows a parabolic curve due to uniform acceleration.
Correct Answer
Detailed Explanation
The speed of the ball decreases by one tenth after each collision, leading to a series of decreasing linear segments on the speed-time graph.
Found an issue with this question?
Related Questions
More from
A ball is thrown vertically upward with an initial velocity of 20 m/s. If the acceleration due to gravity is -10 m/s², what is the maximum height it r...
Assertion (A): For uniform motion, the acceleration is zero. | Reason (R): The velocity-time graph for uniform motion is a straight line parallel to t...
A car travels along a straight road with a uniform acceleration. If its initial velocity is 10 m/s and it reaches a velocity of 30 m/s in 5 seconds, w...