

NEET2024Physics-Gas Laws
NEET 2024 Physics Charles's Law MCQ Question
Type: MCQ-conceptual-Medium-Class 11
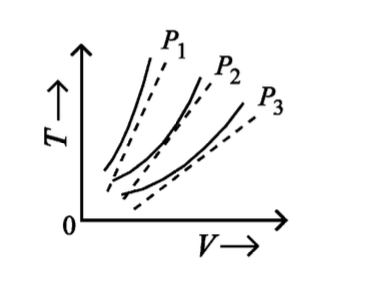
The following graph represents the T⁻V curves of an ideal gas (where T is the temperature and V the volume) at three pressures P₁, P₂ and P₃ compared with those of Charles’s law represented as dotted lines. Then the correct relation is:
A
P₂ > P₁ > P₃
B
P₁ > P₂ > P₃
C
P₃ > P₂ > P₁
D
P₁ > P₃ > P₂
Correct Answer
Option B
Detailed Explanation
According to Charles's law, for a given mass of gas at constant pressure, the volume is directly proportional to its temperature. The graph shows that P₂ has the steepest slope, indicating the highest pressure.
Found an issue with this question?