NEET2024Physics-Kinematics
NEET 2024 Physics Velocity and Acceleration Graphs MCQ Question
Type: MCQ-conceptual-Medium-Class 11
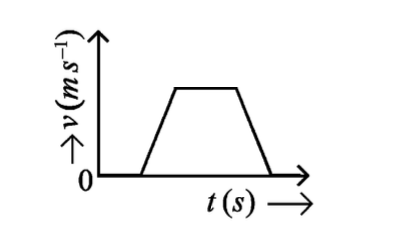
The velocity (v) – time (t) plot of the motion of a body is shown below. The acceleration (a) – time (t) graph that best suits this motion is:
Correct Answer
Option A
Detailed Explanation
The velocity-time graph shows a constant velocity followed by a sudden stop. The acceleration-time graph should show zero acceleration during constant velocity and a negative spike when the velocity drops to zero.
Found an issue with this question?