Botany-(general)
NEET Botany (general) MCQ Question
Type: MCQ-diagram based-Hard-Class 12
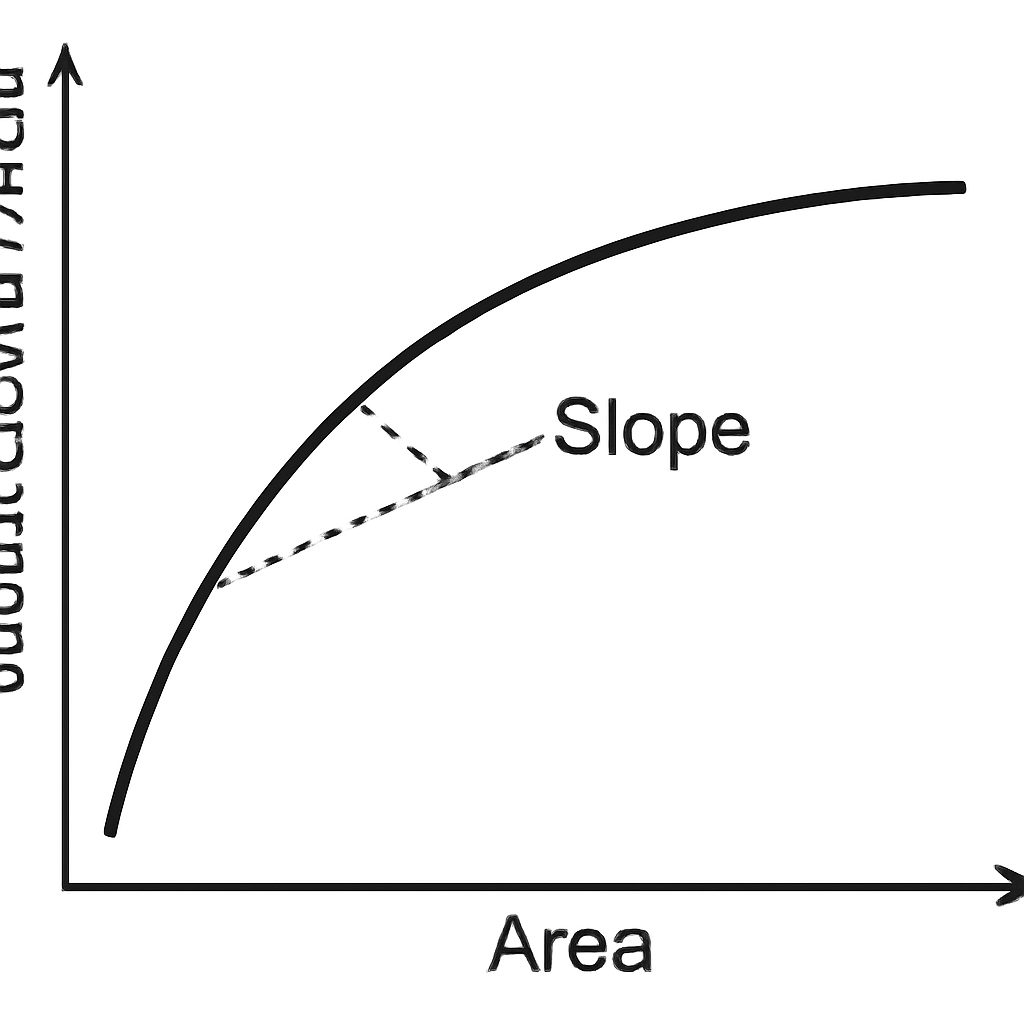
In a hypothetical diagram illustrating species-area relationships, a curve shows that species richness increases with the area explored but plateaus beyond a certain point. What does the slope of the regression line in this species-area relationship signify?
A
The rate of increase in species richness with area.
B
The maximum species richness attainable.
C
The minimum area required for species diversity.
D
The limit of species extinction threat.
Correct Answer
Option A
Detailed Explanation
According to the NCERT context, the slope of the regression in the species-area relationship indicates the rate at which species richness increases with the explored area.
Found an issue with this question?