Botany-(general)
NEET Botany (general) MCQ Question
Type: MCQ-diagram based-Medium-Class 12
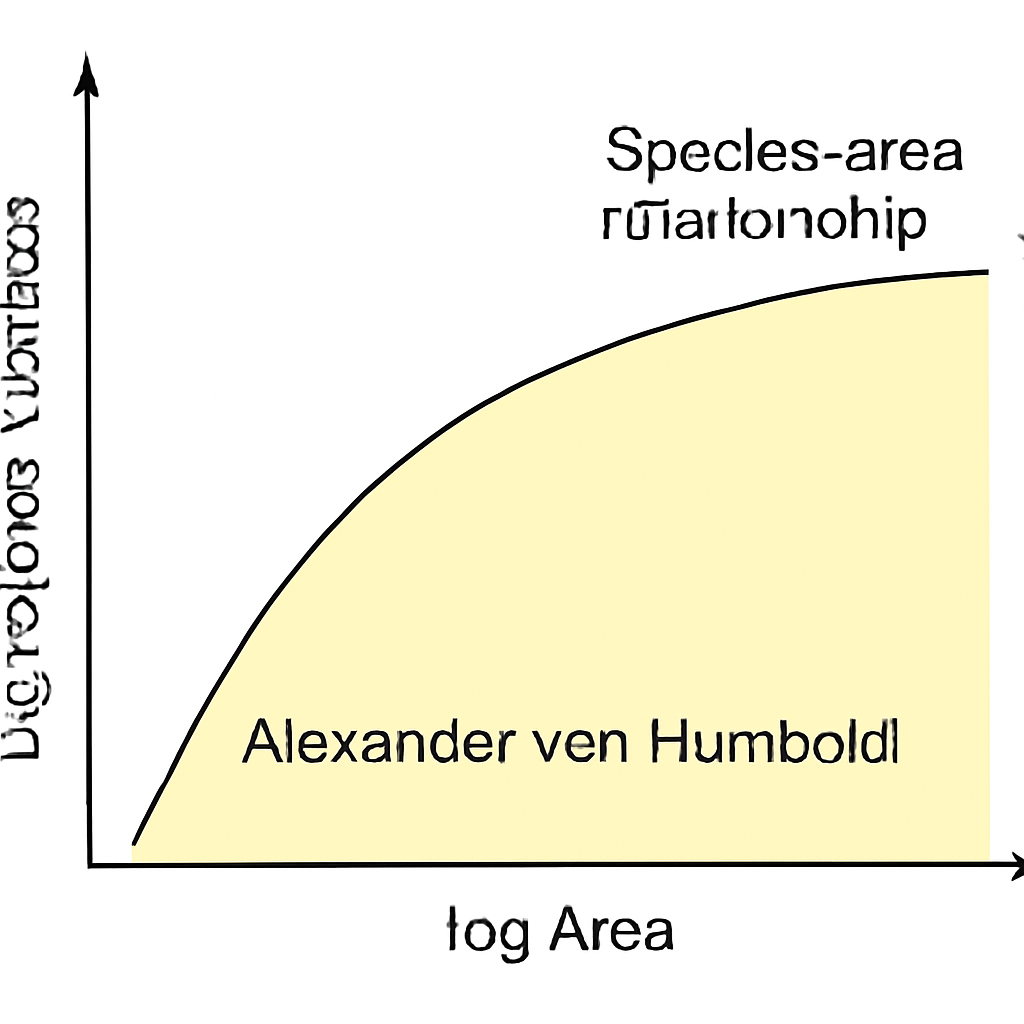
Consider a diagram showing the species-area relationship graph as observed by Alexander von Humboldt. Which of the following best describes the slope of the regression line in this relationship?
A
The slope indicates the rate at which species richness increases with area.
B
The slope represents the total number of species in the explored area.
C
The slope shows the decrease in species richness beyond a certain area.
D
The slope is unrelated to the size of the area explored.
Correct Answer
Option A
Detailed Explanation
The slope of the regression line in a species-area relationship graph indicates the rate at which species richness increases with the explored area, highlighting the limit up to which this increase occurs.
Found an issue with this question?