

Botany-(general)
NEET Botany (general) MCQ Question
Type: MCQ-diagram based-Medium-Class 12
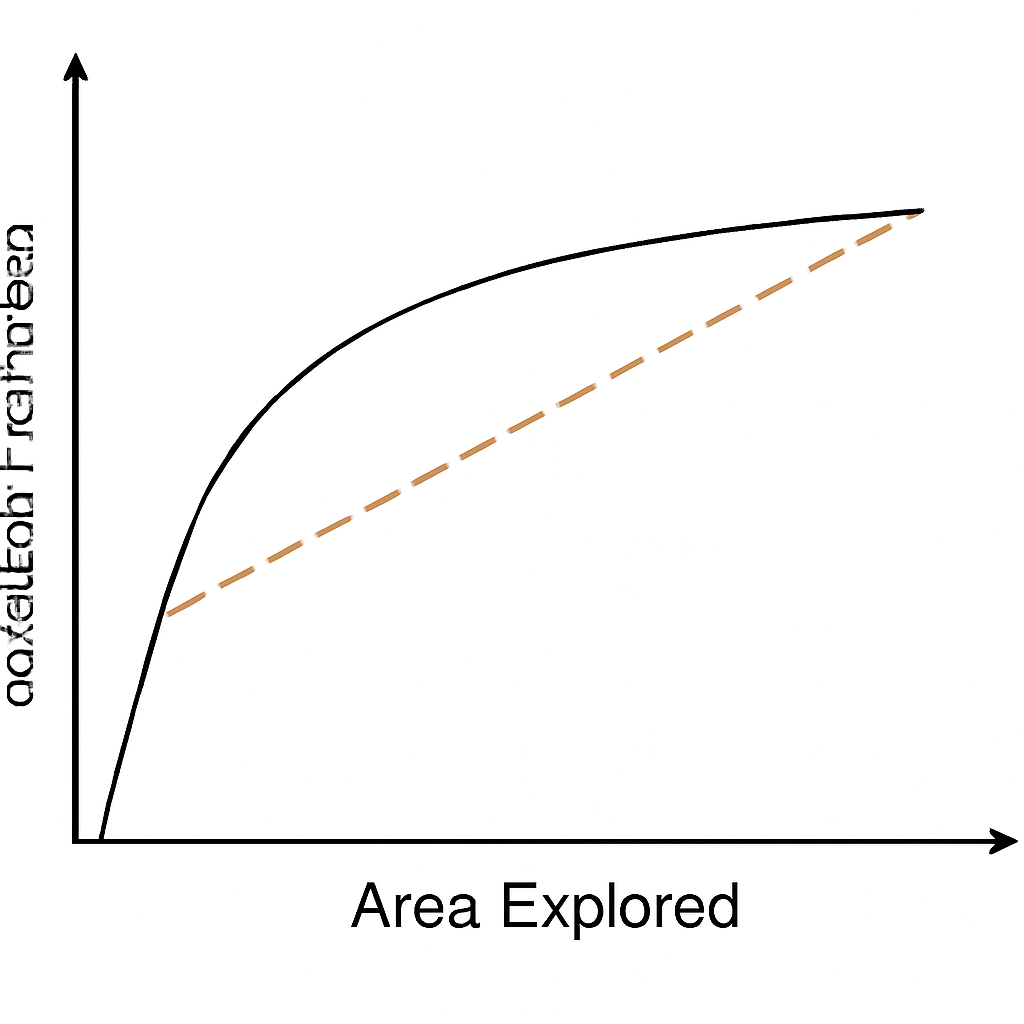
A diagram shows a graph with an x-axis labeled 'Area Explored' and a y-axis labeled 'Species Richness'. The graph depicts a curve that initially rises steeply and then gradually levels off. What does the slope of the regression line in this species-area relationship signify?
A
The rate at which species richness increases with area.
B
The maximum number of species that can exist in an area.
C
The total biodiversity present in a given region.
D
The correlation between temperature and species richness.
Correct Answer
Option A
Detailed Explanation
The slope of the regression line in a species-area relationship indicates how species richness increases with the explored area, as observed by Alexander von Humboldt.
Found an issue with this question?