NEET Botany Biodiversity Patterns MCQ Question
Consider a diagram showing a species-area relationship where the x-axis represents the area of a region and the y-axis represents the number of species found. Which of the following best describes the pattern shown in this diagram?
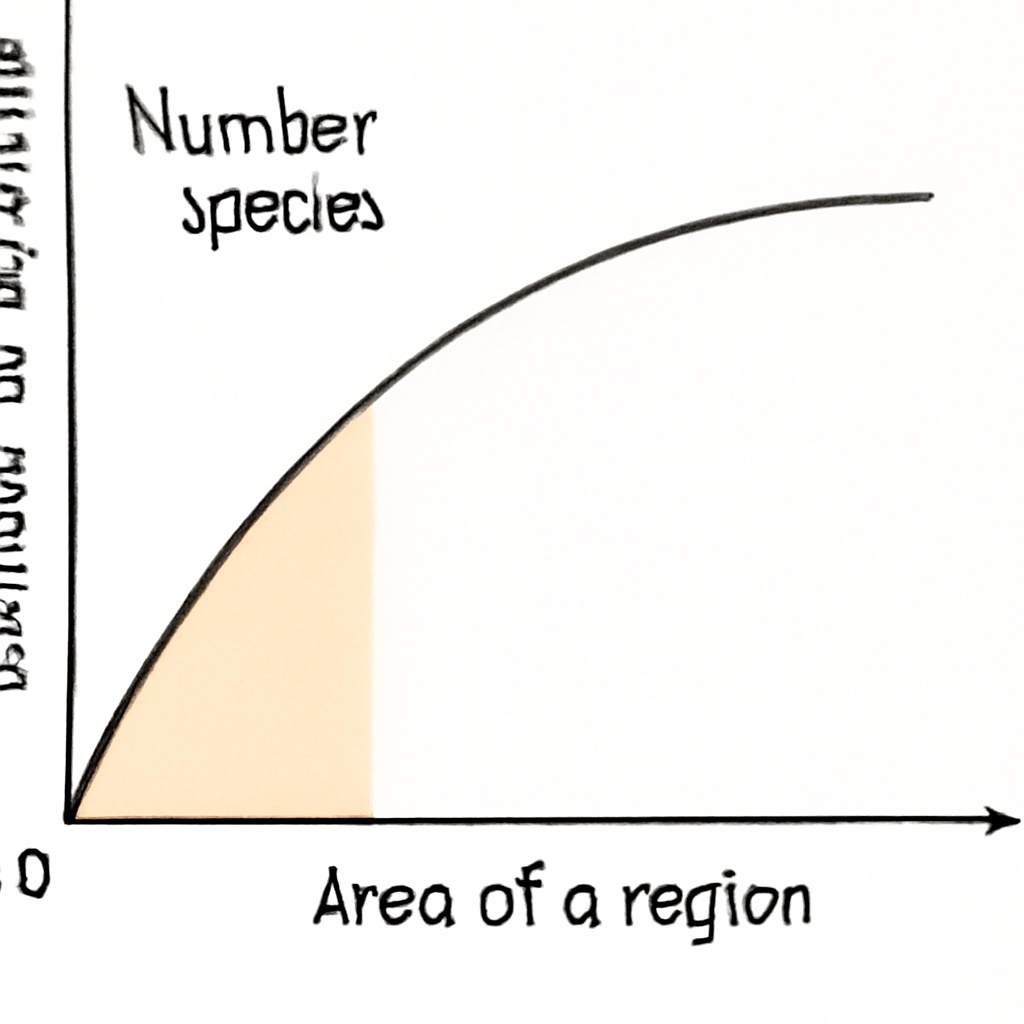
Species richness increases with the area of the region.
Species richness decreases with the area of the region.
Species richness remains constant regardless of the area of the region.
Species richness is highest at intermediate areas of the region.
Correct Answer
Detailed Explanation
The species-area relationship indicates that species richness generally increases with the area of a region, as larger areas tend to support more diverse habitats and resources, leading to greater biodiversity.
Found an issue with this question?
Related Questions
More from Biodiversity Patterns
More from
What percentage of the total oxygen in the earth’s atmosphere is estimated to be produced by the dwindling Amazon forest through photosynthesis?
Which of the following factors contributes to higher species diversity in tropical environments?
What percentage of all mammal species currently face the threat of extinction?