

AIPMT PRELIMS2011Zoology-Enzymes
AIPMT PRELIMS 2011 Zoology Enzyme Activity MCQ Question
Type: MCQ-conceptual-Medium-Class 11
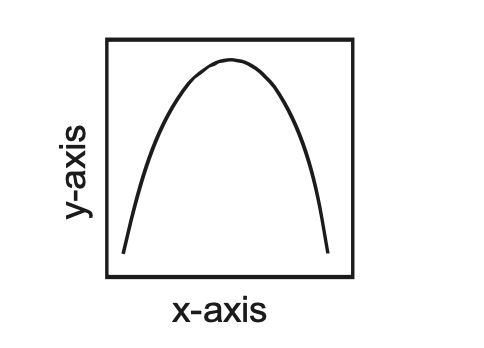
The curve given below show enzymatic activity with relation to three conditions (pH, temperature and substrate concentration). What do the two axises(x and y) represent?
A
Enzymatic activity, Temperature
B
Enzymatic activity, pH
C
Temperature, Enzyme Activity
D
Substrate concentration, Enzymatic Activity
Correct Answer
Option C
Detailed Explanation
X⁻axis represent temperature and Y⁻axis represent enzyme activity. All enzymes act at an optimum temperature, above and below this temperature the enzyme activity declines.
Found an issue with this question?