

AIPMT PRELIMS2012Physics-Thermodynamics
AIPMT PRELIMS 2012 Physics Heat and Temperature MCQ Question
Type: MCQ-conceptual-Easy-Class 11
Liquid oxygen at 50 K is heated to 300 K at constant pressure of 1 atm. The rate of heating is constant. Which one of the following graphs represents the variation of temperature with time?
A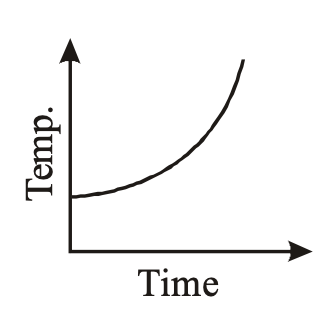
B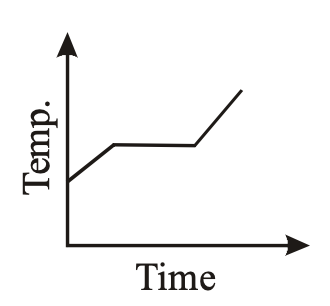
C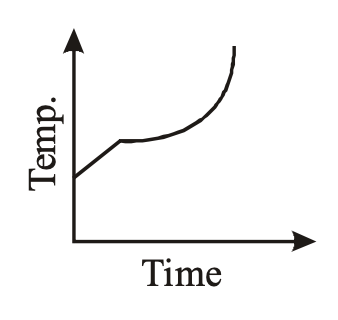
D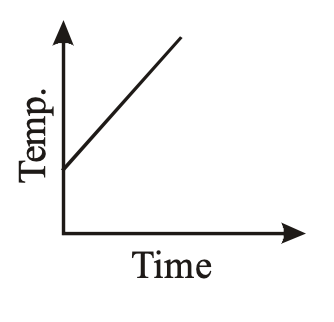
Correct Answer
Option B
Detailed Explanation
Since the rate of heating is constant, the temperature increases linearly with time. Therefore, the graph showing a straight line with a positive slope represents the variation correctly.
Found an issue with this question?