

AIIMS 2005 Chemistry Equilibrium and Thermodynamics MCQ Question
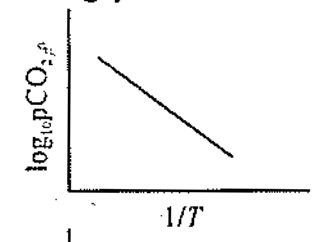
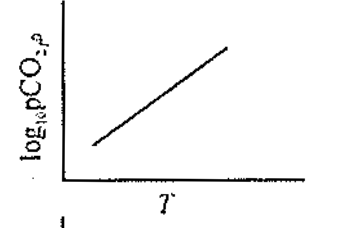
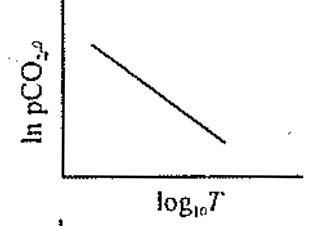
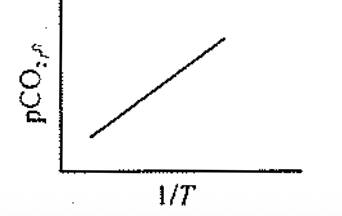
For the chemical equilibrium, CaCO₃(s) ⇌ CaO(s) + CO₂(g), ΔH°f can be determined from which one of the following plots?
Correct Answer
Detailed Explanation
To determine the standard enthalpy of formation () for the equilibrium reaction
we can use the principles of chemical thermodynamics, specifically the relationship between the equilibrium constant and temperature.
Explanation of the Correct Answer (A)
The correct answer to the question is A) logₑ PCO₂ vs 1/T. This can be understood through the van 't Hoff equation, which relates the change in the equilibrium constant with temperature :
where:
- is the equilibrium constant,
- is the standard enthalpy change,
- is the universal gas constant,
- is a constant.
For the given reaction, the equilibrium constant at a given temperature can be expressed in terms of the partial pressure of :
Thus, we can rewrite the equation as:
If we take the natural log of and plot it against , the slope of this line will be . Therefore, we can determine from the slope of the plot.
Why Other Options are Incorrect
B) logₑ PCO₂ vs T: This option would imply a direct relationship between the logarithm of the partial pressure and temperature, which does not correspond to the van 't Hoff equation. The equation directly relates to , not . Therefore, this plot would not yield information regarding .
C) ln PCO₂ vs logₑ T: In this case, the plot involves the natural logarithm of versus the logarithm of temperature. This does not fit the form of the van 't Hoff equation and would not provide a linear relationship that expresses in a straightforward manner.
D) PCO₂ vs 1/T: This plot directly relates the partial pressure of to . However, this relationship is not linear. The expected nature of the relationship between and does not allow for the direct extraction of as a slope, which is why this option is also incorrect.
Summary
To summarize, plotting against (Option A) allows for the determination of the standard enthalpy of formation due to the linear relationship defined by the van 't Hoff equation. In contrast, the other options do not yield a usable linear form for determining .
Found an issue with this question?
Related Questions
More from 2005
AIDS is caused by HIV that principally infects:
Assertion : The logic gate NOT can be built using diode. Reason : The output voltage and the input voltage of the diode have 180° phase difference.
In a semiconducting material the mobilities of electrons and holes are μₑ and μₕ, respectively. Which of the following is true?